Chart Data Task Pane and PivotTables with Images and Data Types

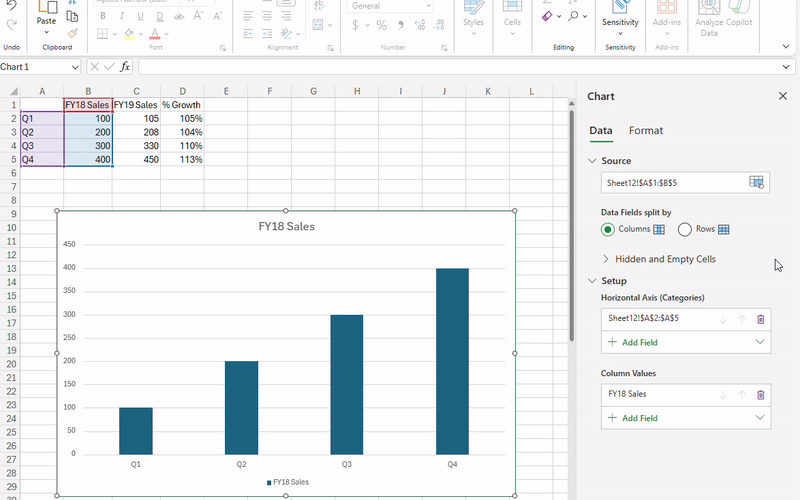
Microsoft Excel has introduced a Chart Data Task Pane for Excel for the web, which allows users to edit their chart’s data more intuitively. With this new pane, you can change a chart’s source data range, determine how data series are displayed on the chart, and configure how hidden or empty cells appear1.
Additionally, Excel now supports the inclusion of images and other data types like Stocks and Geography in PivotTables. This means you can create richer and more visually appealing PivotTables that include images and data types, which were previously limited to text descriptions1.
These features are part of the February 2024 update and are sure to enhance the functionality and visual appeal of Excel spreadsheets. You can explore these features in more detail and share your insights on how they can be utilized effectively in various scenarios.
